Artists in Paris is an interactive research tool for investigating the geography of the 18th-century Paris art world. There are many different ways to access the data in this site and explore the maps. In this Guide, you’ll find explanations of the website’s key features and suggestions to help you get started. You’ll also find other useful information in Frequently Asked Questions (FAQs).
The navigation panel is the website’s main control area. There are three buttons – Explore, Settings, and Cite & Save – which display three different screens within the navigation panel.
Explore: This is the main screen containing the site’s two search modes (see Search Modes below). Once you’ve selected a search mode, this area is where you conduct search activities and find additional information relating to your inquiries.
Settings: This screen provides options for displaying information on the map. For instance, you can select different historical maps or turn them off entirely; you can switch the markers on and off; or you can turn all the coloured markers into black markers (this might be helpful if you want to print a map).
Cite & Save: This screen provides: citation information so you can reference this website; a unique URL for the map you’ve made so you can record it or share it; and a save option so you can download your map as an image.
The navigation panel also contains the site’s information pages (About, FAQs, Guide, and Publications). When reading these pages, you can return to the map by clicking Map or the site logo.
You can open and close the navigation panel by clicking the arrow on the side of the bar.
In the lower-left hand corner of the map, you’ll find zoom controls and view options.
You can zoom in or out of the map with the +/- buttons or by using your mouse or trackpad.
There are also more specific zooming options. The Fit All button shows all the addresses on the map (including artists who might not be living in Paris); and the Fit Paris buttons returns the map to the city view.
There is also a Full-Screen View button which expands the window and hides other elements.
There are two types of markers on the maps: circular and building icons.
Circular markers represent artists and indicate the location of an address at which they lived. Normally these markers are coloured according to the media or genre in which the artist practiced. They can be viewed in monochrome mode via the Settings screen.
Building icon markers indicate the locations of art-world sites or other places of interest. These are designed to help orient explorations through the city. They can be switched off in Settings.
Click on a marker to display information about the artist or site.
There are two different modes for searching the maps: Year and Artist. You can switch between them by selecting the Year or Artist tab in the navigation panel (make sure you’re on the Explore screen).
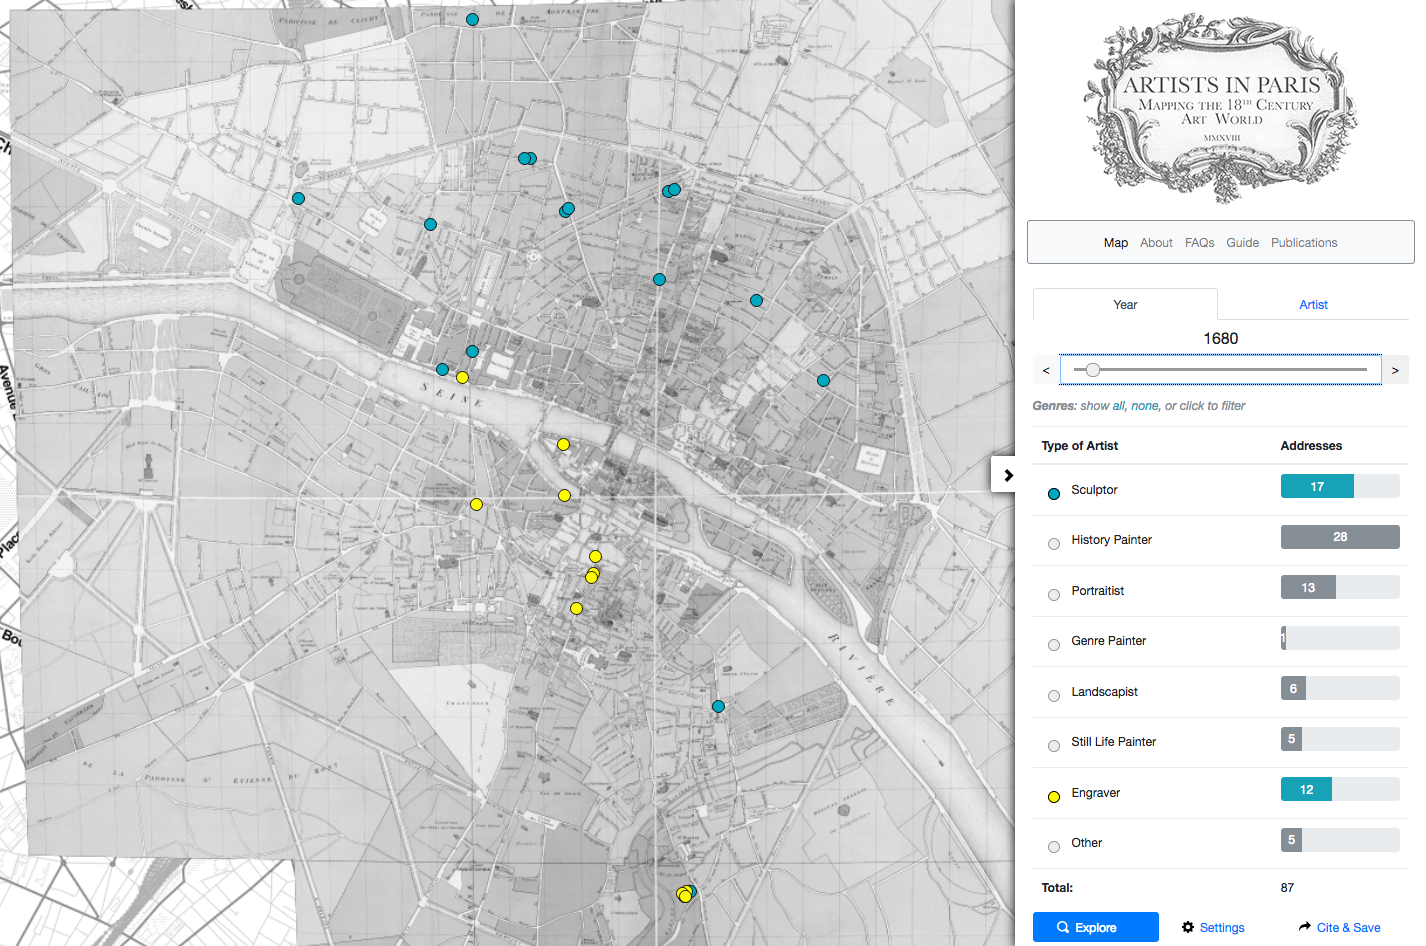
In Year mode, the map displays the addresses of every artist for a single year. You can use the slider to change the year to compare where artists were living at different moments across the century. Underneath the slider is a key showing the different types of artists; the number beside the category indicates how many members there were of that type in the given year.
In Artist mode, the map displays all the addresses that an individual artist lived at throughout their career at the Academy. You can search for artists by typing names into the search box. The navigation panel displays some biographical information about the artist and a list of their addresses in chronological order. Clicking on an address will open information on the relevant marker.
Once you’re oriented with the basics, you can start searching the maps. Below you’ll find examples of searches you can do to help get you started. But there are lots of different ways to explore the maps and data, so feel free to get creative.
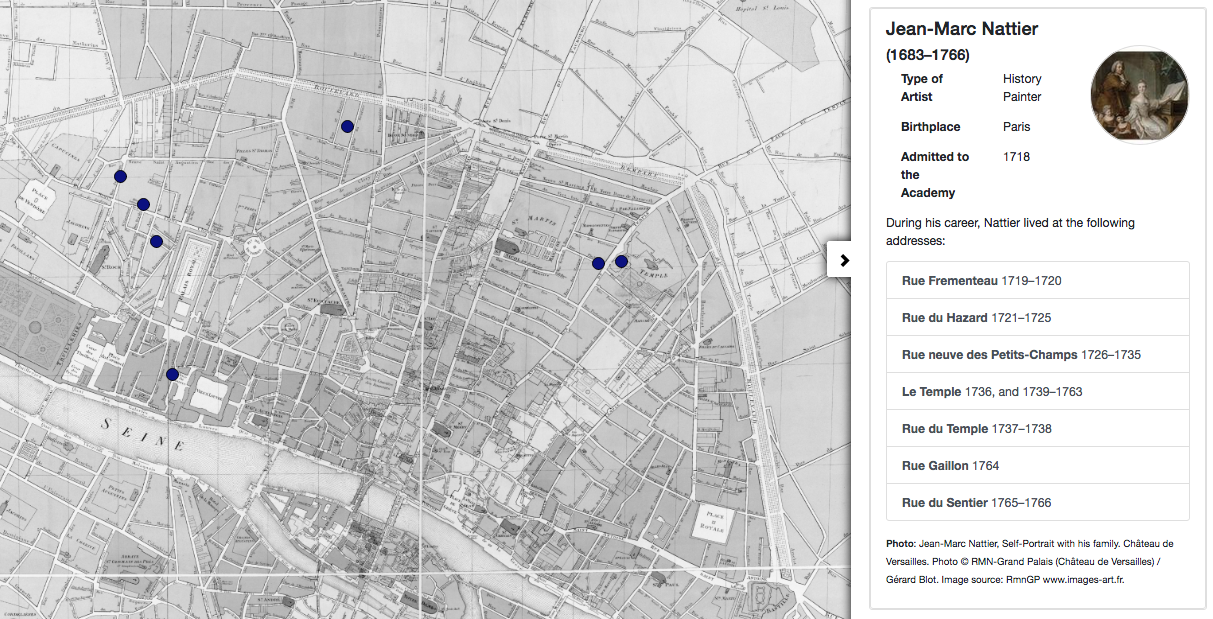
Maybe you’re interested in a particular artist. Click the ‘Artist’ tab in the navigation panel and start typing their name in the ‘Search for artists…’ box. Select the name when it appears in the list. (Hint: if you don’t have a particular artist in mind, just type at least two letters and you’ll start getting options). Once you select your artist, the map will display all the addresses at which that person lived during their career.
Example 1: The artist selected is Jean-Marc Nattier and the map shows the 7 addresses he lived at during his career. In the navigation panel, you’ll find these addresses listed in chronological order along with some biographical information about Nattier. Click here to see this search.
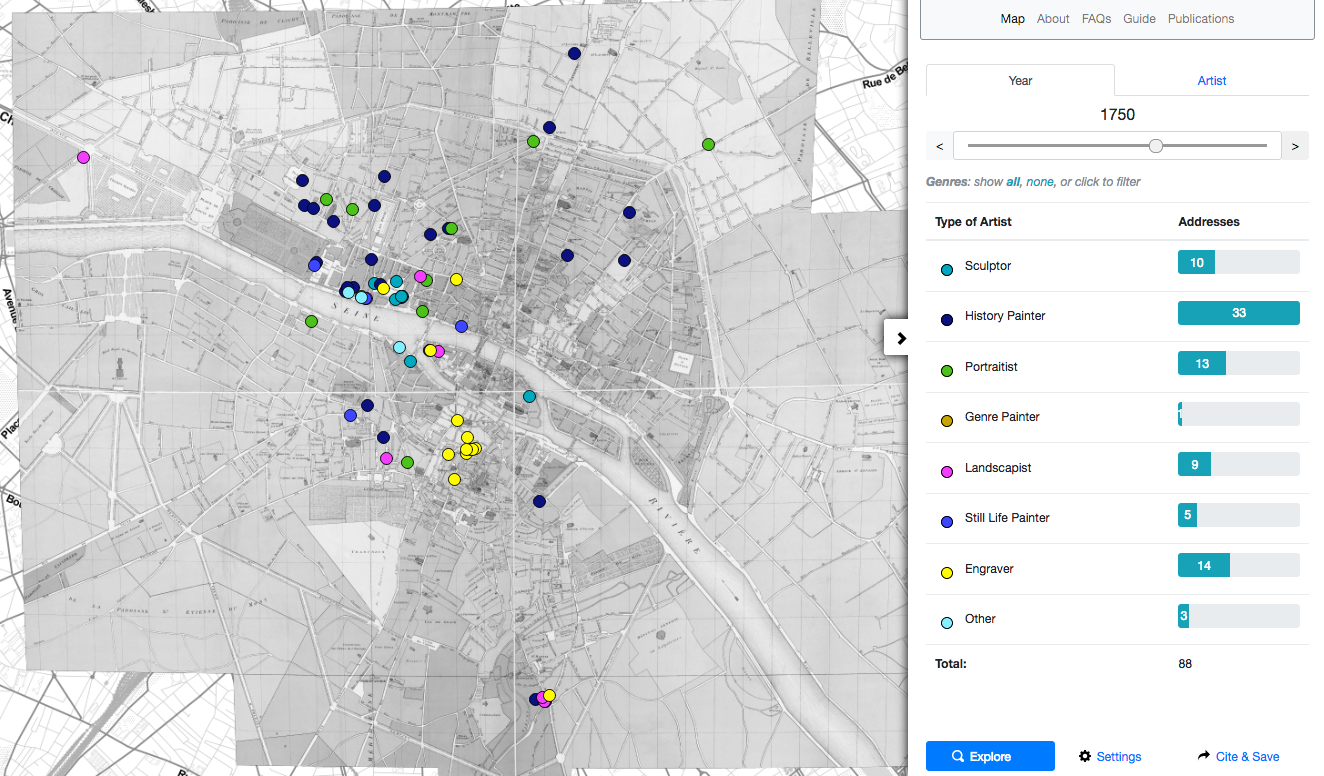
Maybe you’re interested in a particular date. Click the ‘Year’ tab in the navigation
panel and move the slider along until you reach the date you want. You can also use the arrows at each end to move year by year. Once you select a year, the map will display the addresses of every artist who was at the Academy at that time. Most artists lived in Paris, but some travelled abroad so there might be markers outside the city (Hint: try clicking ‘Fit All’ to check if any markers are outside Paris; then return by clicking ‘Fit Paris’).
Example 2: The year selected is 1750 and the map is showing the addresses of all the artists in Paris. In the navigation panel, you can see how many artists have been mapped and what genre or media they practiced. Click here to see this search.
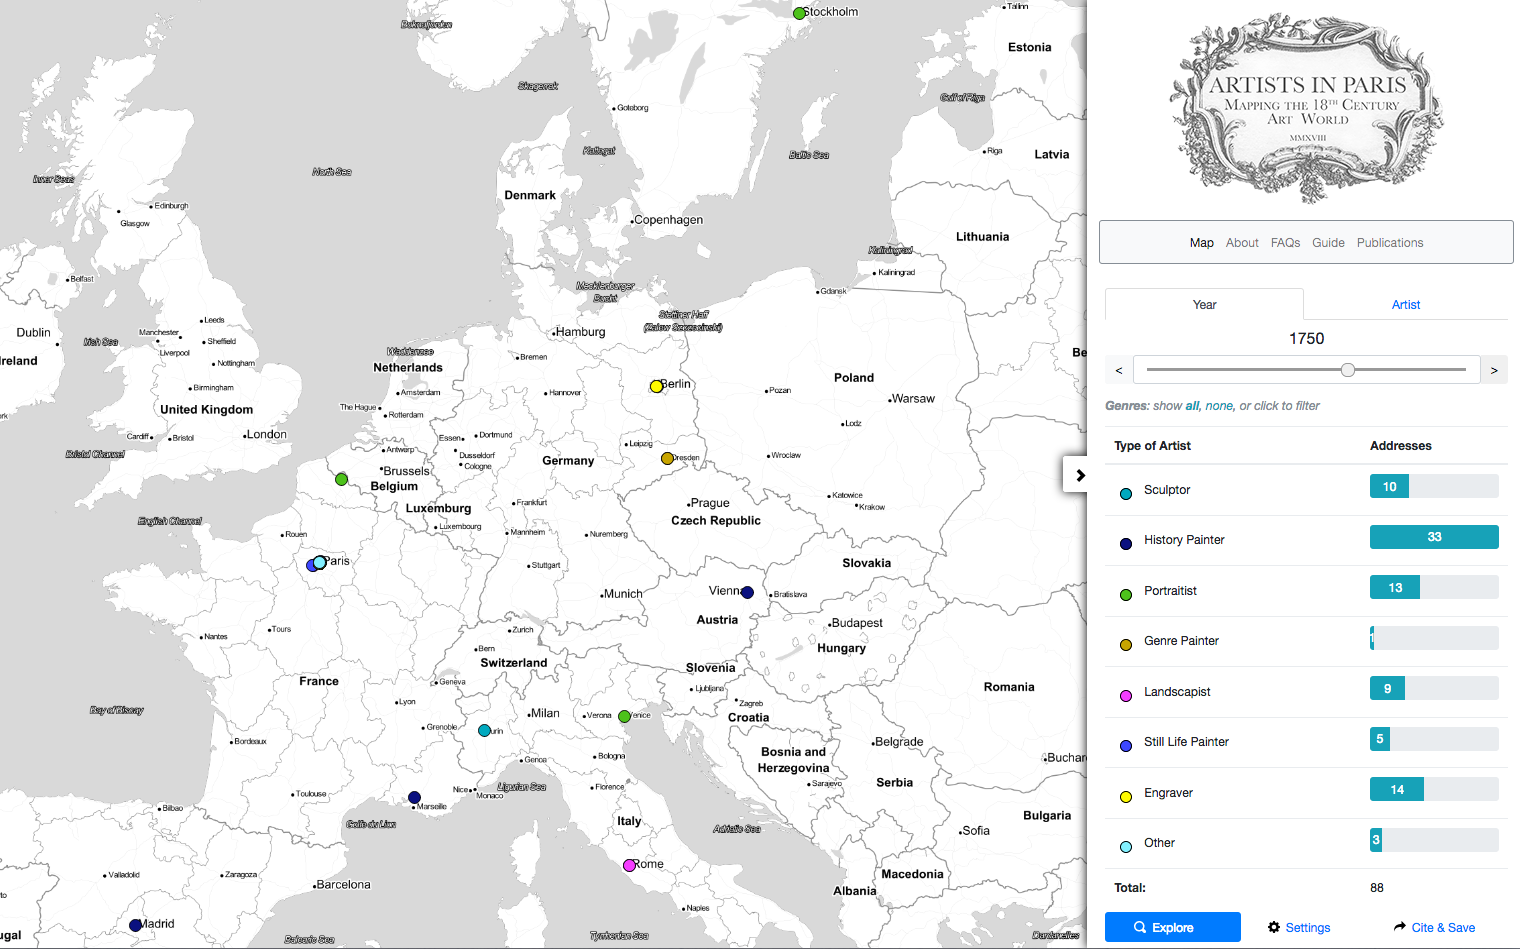
Example 3: The year selected is still 1750, but the map is now zoomed to ‘Fit All’. Here we can see that 13 of the Academy’s 88 artists were living outside of Paris, in cities from Stockholm to Madrid. You can find out who these artists were by clicking on the markers.
Maybe you’re interested in a particular type of artist (e.g. sculptors, engravers, or portraitists, etc). In Year mode, you can filter your search so that only certain types of artist appear on the map. Select the media you want by clicking its marker under ‘Type of Artist’; everything else will switch off. You can add individual media by clicking their markers, or you can turn everything on and off by clicking show ‘all’ or ‘none’. If you filter by type of artist, and then move the slider forward across the century, you can explore sub-communities of artists at different times.
Example 4: In this search, the year selected is 1680 and the filter has been set to show only sculptors on the map. Click here to see this search.

Example 5: This is the same search for 1680, but with the filter set to show both sculptors and engravers. This comparison shows a density of sculptors on the Right Bank and a density of engravers on the Left Bank. Click here to see this search.
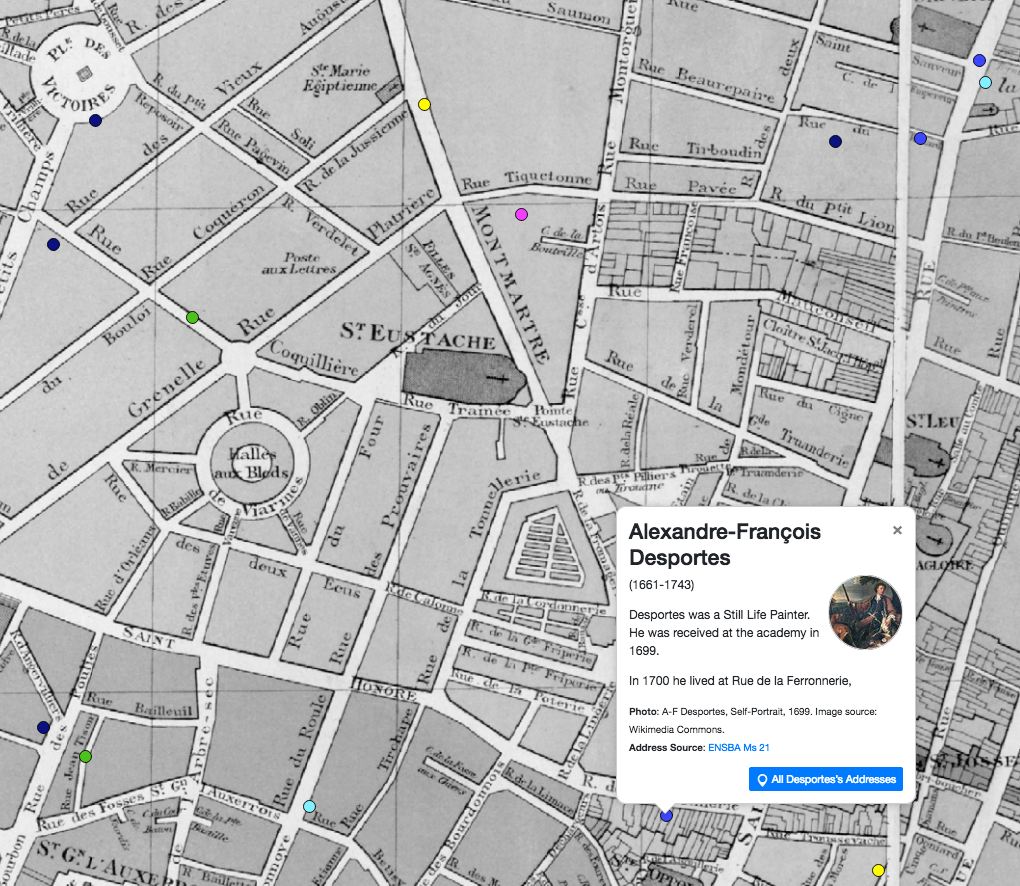
Maybe you’re interested in a particular neighbourhood of Paris. Centre the map on your selected neighbourhood and zoom in to focus on this area. In Year mode, you can move the slider forwards to see how many artists were living in this neighbourhood at different moments across the century. If you want to find out who any of these artists were, click on the marker to read the pop-up information box.
Example 6: Here the map has been zoomed to show the neighbourhood around the market of Les Halles and the parish of Saint-Eustache. The year selected is 1700, when several artists were living around this area. The artist selected is Alexandre-François Desportes, a still life painter who was living right opposite the Cemetery of the Holy Innocents.
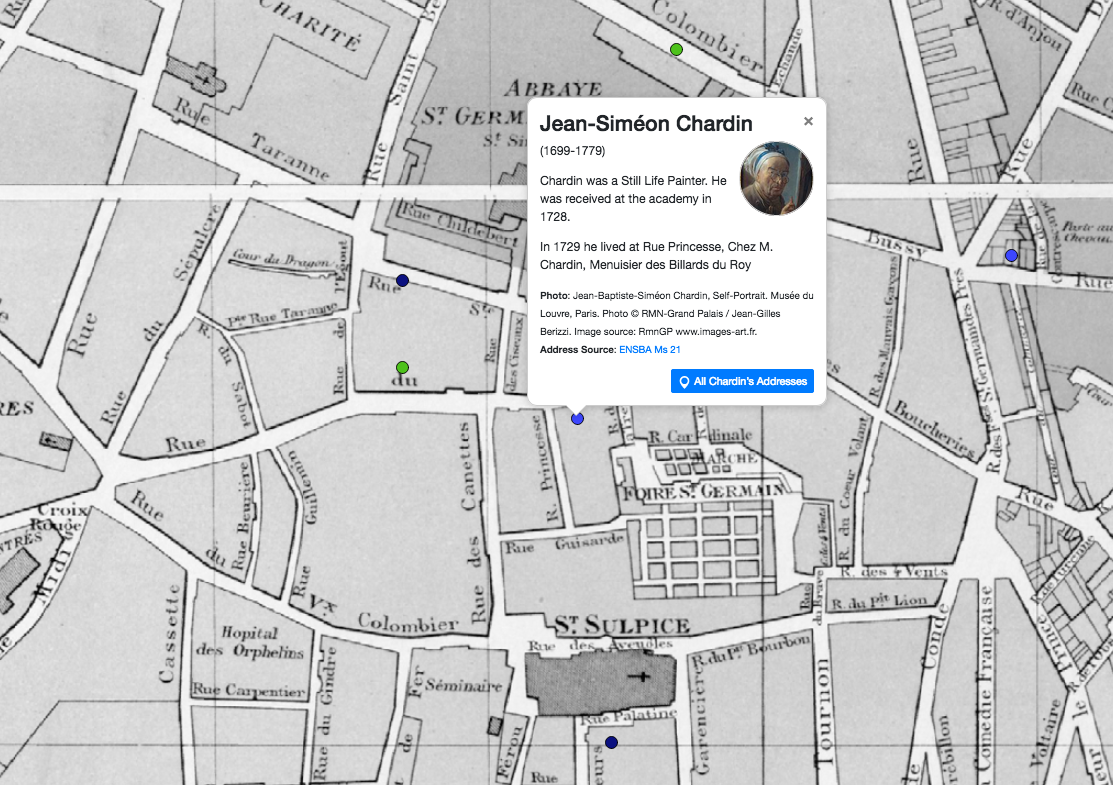
Maybe you’re interested in artists’ social lives and want to find out which artists were neighbours. You can do this by exploring neighbourhoods (as described above), but you can also focus on specific artists. To do this, search for an artist in Artist mode. Then pick one of their addresses, zoom into the map to focus on it, and note the dates at which the artist lived there. Next switch into Year mode, and move the slider between those dates. This way you can see who was living near your artist during that time.
Example 7: This map shows the home of Jean-Siméon Chardin, a long-term resident of the neighbourhood near the Foire Saint-Germain and the church of Saint-Sulpice. In 1729, as this map shows, Chardin had several nearby neighbours (clicking on them, you’ll discover they are: Claude-Guy Hallé, Nicolas-Simon-Alexis Belle, Joseph Christophe, François Jouvenet, and Pierre-Nicolas Huilliot).
Prepare your data in an spreadsheet application (Microsoft Excel or similar). You will need to have a minimum of two labeled columns: “latitude” and “longitude”. These will determine the location of each point. You may also have a “name” column and a “description” column. This information will appear in a pop-up when the related point on the map is clicked. NB: make sure you include these words in your column headings and that you use lower case. For example:
| name | longitude | latitude |
|---|---|---|
| EYSEN | 2.34051704 | 48.8528562 |
| NAUDIN | 2.33891845 | 48.8558423 |
| DUCREUX | 2.34215856 | 48.8524326 |
| BORNET | 2.33876824 | 48.8557223 |
Once you have prepared your data, copy it from your spreadsheet and paste it in the box under the Your Data tab. Select the colour you’d like for your markers by clicking the icon shape below the box. Then select whether you want small or standard sized markers. Finally, click “Map It!” and your data will appear on the map.
You can change the display of your data on the map by adjusting what else is on the map. You could return to the Year or Artist tabs and change the other data being displayed on the map. Or you switch to the Settings screen, and change all the other markers to monochrome, switch of art world site, or switch off everything else entirely. For example, here is a screenshot showing all the Academy’s artists in 1776 (as black markers) with additional data added to show all the Guild’s artists in 1776 (as orange markers).

![]()
![]()